 Modelando
Terrenos
Modelando
TerrenosProjetando Paisagens
Modelando
TerrenosThe sitework-related commands allow the development of complex 2D and 3D models of site terrain in the Vectorworks Architect and Landmark products. The Vectorworks Landmark product contains certain additional commands.
A site model can either be generated as custom terrain based on a closed shape, or from elevation source data. The source data for a site model is the 3D information used to create a representation of the existing site. The information can be in the form of surveyor data, 3D loci, polygons, polylines, and stake objects. The site model object created from the source data contains both 2D and 3D site information, and it can be copied to other layers and files. Special “snapshot” copies of the site model allow different forms of the site model to be shown side by side.
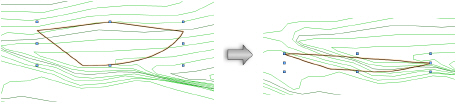
Once generated, two forms of the site model can be displayed—the existing site model and the proposed site model. The existing site model is a representation of the site before any grading work or other site modifications have been done. The proposed site model is the existing site model, plus the geometric effects of proposed site modifiers, such as edited contours, roads, and pads. The existing and proposed site models can be displayed or hidden at creation or from the Object Info palette.
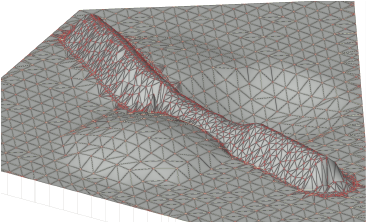
Site models use the Triangulated Irregular Network (TIN) method to connect input data. This method can work with data that are scattered and in clumps—they do not have to be organized in a rectangular grid. The model uses all the data, without doing approximations, to create a network of triangles. These triangles form the terrain model; the model then performs interpolation to calculate the threading of contour lines.
After generation, the site model is cached by default so that updating occurs more efficiently; however, large file sizes can result. See Aba Visualização for information on changing the default setting.
To upgrade a site model from a previous version of the Vectorworks program, see Migrando de Versões Anteriores.
~~~~~~~~~~~~~~~~~~~~~~~~~
 Site
Model Source Data
Site
Model Source DataThere are five commands available to input source data into a drawing for the development of a site model; each uses a different type of source information.
• Import Survey File
• 2D Polys to 3D Source Data
• 3D Polys to 3D Loci (Vectorworks Landmark only)
• Grid Method Entry
• Extract 3D Loci from Point Cloud
In addition, stake objects, 3D loci, or 3D polygons can be used directly as the source data for the site model. No conversion is necessary before using this type of source data.
The Modify by Record command can convert 2D polygons or polylines with attached record elevation data directly to 3D polygons at the proper elevation. See Modifying Objects by Record Value.
Before you create the site model, check the source data with the Validate 3D Data command to ensure that a valid site model will be created.
|
Click here for a video tip about this topic (internet access required). |
~~~~~~~~~~~~~~~~~~~~~~~~~
 Importing
Source Data from an External File
Importing
Source Data from an External FileCommand |
Workspace: Path |
|---|---|
Import Survey File |
• Architect: AEC > Survey Input • Landmark: Landmark > Survey Input |
Site model source data can be generated by tabular coordinate information from an external file. This file must be a text file with fields delimited by separators in one of the formats available.
To import survey information for use as source data:
1 On the layer to receive the imported data, select Active Layer Scale from the drawing context menu to set the scale, or select the File > Document Settings > Document Setup command (see Document Setup).
2 Select the command.
The standard Open File dialog box opens. Select the file to import.
3 The Import Survey File dialog box opens. Specify the file format options, scrolling through each line of data if necessary, and set the file import options.
► Click to show/hide the parameters.
As each line of the file is read, either 3D loci or stake objects are inserted into the drawing at the coordinates specified by the file. If this is the first time a stake object has been inserted in the drawing, the Object Preferences dialog box opens. Accept the defaults.
~~~~~~~~~~~~~~~~~~~~~~~~~
 Adding Source
Data with 2D Polygons or Polylines
Adding Source
Data with 2D Polygons or PolylinesCommand |
Workspace: Path |
|---|---|
2D Polys to 3D Source Data |
• Architect: AEC > Survey Input • Landmark: Landmark > Survey Input |
Another way to generate the site model source data is to draw, trace, or import 2D polygons or polylines representing contours; then use the 2D Polys to 3D Source Data command to convert the polygons or polylines to 3D polygons or 3D loci.
The Modify by Record command can convert 2D polygons or polylines with attached record elevation data directly to 3D polygons at the proper elevation. See Modifying Objects by Record Value.
To generate source data with the 2D Polys to 3D Source Data command:
1 Create or import the 2D polygons or polylines representing contour lines.
2 Select the command.
The 2D Polys to 3D Source Data dialog box opens. Enter the first elevation and change in elevation between contour lines, specify the smoothness of the source data conversion, and then select the type of object to be created.
► Click to show/hide the parameters.
The Set Elevation dialog box opens, and the first polygon or polyline in the drawing order is highlighted. If necessary, use the Up or Dn buttons to set the elevation of the highlighted polygon or polyline, and then click Next. When prompted, indicate whether to delete the original items.
► Click to show/hide the parameters.
3 Repeat for all of the polygons or polylines in the drawing.
To interrupt this process, click Done. To resume setting elevations, select the starting polygon or polyline and select the 2D Polys to 3D Source Data command.
Either 3D polygons or loci are created from the polygons or polylines, with Z values equal to the assigned elevations. These Z values can be edited from the Object Info Palette if they are incorrect.
~~~~~~~~~~~~~~~~~~~~~~~~~
 Converting 3D
Polygons to 3D Loci
Converting 3D
Polygons to 3D LociCommand |
Workspace: Path |
|---|---|
Import Survey File |
• Designer: AEC > Survey Input • Landmark: Landmark > Survey Input |
The 3D Polys to 3D Loci command converts the vertices of selected 3D polygons into 3D loci. These loci can then be used to create the site model.
To create 3D loci from selected 3D polygons:
1 Select the 3D polygons to convert from the current layer.
2 Select the command.
The 3D Poly to 3D Loci Command dialog box opens.
3 To remove the 3D polygons, select Delete original 3D polygons.
The vertices of the selected 3D polygons located in the current layer are converted to 3D loci. The loci retain the Z values of the original polygons. These 3D loci can then serve as source data for the site model, or can be converted to stake objects and modify an existing site model.

~~~~~~~~~~~~~~~~~~~~~~~~~
 Adding Source
Data by Grid Method Entry
Adding Source
Data by Grid Method EntryCommand |
Workspace: Path |
|---|---|
Grid Method Entry |
• Architect: AEC > Survey Input • Landmark: Landmark > Survey Input |
The Grid Method Entry command creates a rectangular grid of points on the screen, and prompts you to enter the elevations of those points. The Create Site Model from Source Data command then creates a topographical model based on those points.
Use this method when the source data is extracted from a paper map. Draw a grid on the map, and then determine the elevation of each grid intersection by interpolation between adjacent contour lines. Use these elevation values to create the grid.
Stake objects inserted with the grid method use the default parameters set in the stake object properties dialog box (see Inserting Stake Objects). They can also be individually selected and edited after placement.
To generate source data using grid method entry:
1 Select the command.
2 When prompted, click at the upper left corner of the grid to set the starting point.
The Point Entry Grid Setup dialog box opens.
3 Enter the number of rows and columns of points to be created, as well as the distance between the points (Grid Spacing). Specify whether to insert the result type of 3D loci or stakes, and then click OK to create the grid.
The Enter Z Values dialog box opens.
4 The first point on the drawing, at the upper left hand corner, is automatically selected. Enter the elevation of the point, and click Next. The elevation is applied to that point, and then the second point in that row is automatically selected. Enter the elevation for that point; continue until elevations have been entered for all of the points in the grid, and then click Done.
~~~~~~~~~~~~~~~~~~~~~~~~~
 Extracting 3D Loci From a Point Cloud
Command |
Path |
|---|---|
Extract 3D Loci from Point Cloud |
• Model > Point Clouds • Context menu |
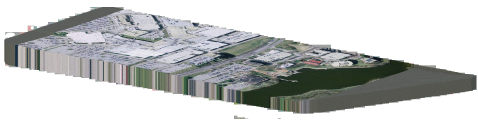
Point cloud scans of existing terrain can be used to create a site model by extracting 3D loci from the imported point cloud. The 3D loci are then used as source data for the site model. (See Editing Point Cloud Objects to prepare the point cloud before extracting the 3D loci.)
To extract 3D loci from a point cloud:
1 Select the point cloud.
2 Select the command.
The Extract 3D Loci from Point Cloud dialog box opens.
► Click to show/hide the parameters.
3D loci are created in the locations of point cloud points and are automatically selected, so they can be used immediately to validate source data or to create a site model. The original point cloud object is not modified.
~~~~~~~~~~~~~~~~~~~~~~~~~
 Validating 3D
Source Data
Validating 3D
Source DataCommand |
Workspace: Path |
|---|---|
Validate 3D Data |
• Architect: AEC > Terrain • Landmark: Landmark > Create Site Model |
Use the Validate 3D Data command before you create the site model, to check the 3D source data for problems. Even if a site model already exists, the source data can be checked. If problems occur due to erroneous site model source data, alerts are automatically displayed. A site model with problems can still be created; however, results may not be as expected.
The following problems can generate an alert:
• Duplicate 3D data points or polygons
• 3D data points that are coincident or vertically placed
• Crossing 3D polygons in the 3D source data
• Missing source data
To validate 3D source data:
1 Select the source data (3D loci, 3D polygons, or stake objects) to be checked.
2 Select the command.
3 If the source data are valid, a dialog box states that no problems were found. Proceed with creating the site model as described in Creating the Site Model.
4 If there are errors in the source data, the Problems with Site Model Source Data dialog box opens.
Problems encountered are listed, and some conditions have an associated button for correcting each one by modifying or deleting the erroneous data.
5 When problem correction is complete, click Close.
Select Validate 3D Data again to ensure that the problems have been corrected.
~~~~~~~~~~~~~~~~~~~~~~~~~
 Simplifying
3D Polygons
Simplifying
3D PolygonsCommand |
Workspace: Path |
|---|---|
Simplify 3D Polygons |
• Architect: AEC > Terrain • Landmark: Landmark > Create Site Model |
If the existing site model was created from 3D polygons (not 3D loci or stakes), you can reduce processing time by removing redundant polygon vertices within a specified tolerance. For example, this removes extra vertices in straight or nearly-straight segments of imported 3D polygons used as source data. This feature does not significantly change the appearance of the site model, but it can dramatically decrease the time it takes to process the model.
The Simplify 3D Polygons command available in Vectorworks Architect and Landmark is specialized for certain site model workflows. To simplify 2D polygons, 3D polygons, and polylines in other workflows, see Simplifying Polygons and Polylines.
To remove redundant 3D polygon vertices:
1 Select the 3D polygon(s). (The original polygons remain unchanged.)
2 Select the command.
The Simplify Selected 3D Polygons dialog box opens.
3 Enter a Simplification Tolerance value, and select a layer from the Put Simplified Result in Layer list.
Redundant vertices are removed from the 3D polygon(s) and the results are sent to the layer specified.
~~~~~~~~~~~~~~~~~~~~~~~~~
 Creating
the Site Model
Creating
the Site ModelCommand |
Workspace: Path |
|---|---|
Site Model from Source Data |
• Architect: AEC > Terrain • Landmark: Landmark > Create Site Model |
A site model can either be created from elevation source data or by Creating a Site Model from a Boundary.
After generation, the site model is cached by default so that updating occurs more efficiently; however, large file sizes can result. See Aba Visualização for information on changing the default setting.
To create a site model from source data:
1 Ensure that valid source data exists. The site model can be created from 3D loci, 3D polygons, stake objects, a point cloud, or by one of the methods described in Site Model Source Data. Verify that there are no problems with the source data with the Validate 3D Data command (see Validating 3D Source Data).
2 Select the source data.
3 Select the command.
If a point cloud is selected as the source data the Site Model Point Density dialog box opens. Enter the number of 3D locus points to extract, or drag the slider to select a number (see Extracting 3D Loci From a Point Cloud).
The Site Model Settings dialog box opens. Specify the site model parameters.
► Click to show/hide the parameters.
► Click to show/hide the parameters.
► Click to show/hide the parameters.
► Click to show/hide the parameters.
~~~~~~~~~~~~~~~~~~~~~~~~~
 Setting
Site Model Graphic Properties
Setting
Site Model Graphic PropertiesThe site model 2D and 3D graphic display properties can be specified to obtain the desired graphic component colors and line styles. In addition, specify the colors for elevation and slope analyses, and for the 3D cut and fill volume representation. These graphic properties can be set when the site model is first created, or changed later by accessing the settings from the Object Info palette.
Changes to the graphic properties are not reflected in the Plan Preview or 3D Preview in the Site Model Settings dialog box.
|
Click here for a video tip about this topic (internet access required). |
To set the site model graphic properties:
1 When creating a new site model, click Graphic Properties from the Site Model Settings dialog box. To edit a current site model, click Site Model Settings from the Object Info palette, double-click the site model, or right-click on a site model and select Edit from the context menu to open the Choose Component dialog box. Select Site Model Settings and click OK, and then click Graphic Properties from the Site Model Settings dialog box.
The Graphic Properties dialog box opens.
2 The top portion of the dialog box offers options for saved settings.
Parameter |
Description |
|---|---|
Settings |
To use a set of saved parameters, select it from the pull-down list; <Active Settings> indicates the parameters currently selected in the dialog box, whether the parameters are set manually or are from a saved set |
Save |
Opens a dialog box to name and save the currently selected parameters so that they can quickly be selected as a set |
Opens the Manage Saved Settings dialog box to rename or delete sets of saved site model parameters |
3 On the Site Model tab, the 2D (existing and proposed) and 3D site model display can be completely customized by selecting the class and color for all components, as well as the line type, line thickness, and, for certain components, marker style. Double-click a line to set attributes, or select the item and click Edit.
An Attributes dialog box opens. Select an overall class for each site model component to control its appearance and visibility. The classes present in the drawing are listed; alternatively, create a new class by selecting New, or select the class named <Site Model Class> which places the site model component in the same class as the site model object.
Each attribute (color, line type, line thickness, and marker) can be set to the “By Class” setting. Click Make all attributes by class to automatically set all parameters by class. The attributes are then controlled by the class assigned to the component. (See Setting Class Attributes.)


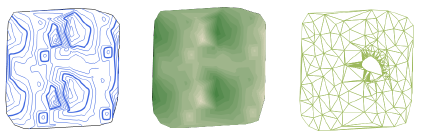
4 On the Site Analysis tab, set the slope and elevation analysis graphic parameters. A slope analysis shows the slope change of the site model with color ranges indicating the steepest to the shallowest slope. An elevation analysis shows the elevation change of the site model as a gradient of color from the minimum to the maximum elevation.
► Click to show/hide the parameters.
5 Click OK to close the Graphic Properties dialog box.
6 To display a slope analysis, select a display style that shows colored slopes. To display an elevation analysis, select a display style that shows colored elevations.

Create a snapshot of the site model to easily display a slope or elevation analysis along with the site model (see Creating a Site Model Snapshot).
To report slope analysis data in a worksheet, use the “Site Slope Analysis” schedule; see Using Preformatted Reports.
~~~~~~~~~~~~~~~~~~~~~~~~~
 Creating
a Site Model from a Boundary
Creating
a Site Model from a BoundaryCommand |
Workspace: Path |
|---|---|
Create Site Model from Boundary |
• Architect: AEC > Terrain • Landmark: Landmark > Create Site Model |
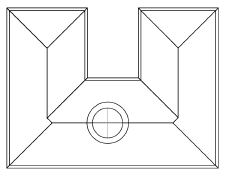
Create a flat, uniformly triangulated site model quickly from a closed 2D polygon or polyline, for shaping and sculpting.
To create a site model from a closed boundary:
1 Create the closed polygon or polyline with the 2D Polygon or Polyline tool.
2 Select the command.
The Site Model from Boundary dialog box opens.The Grid Spacing value determines the site model’s division into rows and columns, with each “cell” further divided into two triangular polygons. (Clipped cells may be subdivided unevenly.)
3 Specify the Grid Spacing value and click OK.
4 Click to set the grid origin point.
The Site Model Settings dialog box opens.
5 Specify the site model settings as described in Creating a Site Model from Source Data.
A flat site model is created based on the boundary shape. To shape it, sculpt it and/or edit its contours.

~~~~~~~~~~~~~~~~~~~~~~~~~
 Setting
Site Model Properties
Setting
Site Model PropertiesAfter the site model has been created, it can be edited in a variety of ways.
• The site model object can be copied, cut, pasted, rotated, and deleted like other objects. In Top/Plan view, the 2D Display selected for the site model is shown; if both existing and proposed models are selected for display, they are superimposed. In any 3D view, the 3D Display selected (if any) is shown.
• The site model can be textured from the Render tab of the Object Info palette. The texture is applied to the surface of the site model, and is scaled to fit the site model bounding box.
• The site model surface can be sculpted, pushing and pulling the surface to create a custom site model as described in Sculpting the Site Model Terrain.
• The site model contours can be edited, changing the original source data (the existing site model) or the proposed site model as described in Editing Site Model Contours.
• Right-click on the site model and select Edit from the context menu, or select Modify > Edit Site Model. From the Choose Component dialog box, choose to edit the Site Model Settings or edit the existing or proposed contours.
• After generation, the site model is cached by default so that updating occurs more efficiently; however, large file sizes can result. See Aba Visualização for information on changing the default setting.
• The site model can be modified by the various site model modifiers; see Site Model Modification Overview.
• In addition to the Site Model Settings dialog box, you can change many parameters of a selected site model from the Object Info palette.
► Click to show/hide the parameters.
The original source data, or boundary and grid-spaced loci, that were used to create the site model can be edited; this operation removes any edits to the site model contours or surface, and recreates the site model, but preserves any site modifier edits.
To recreate the site model:
1 Do one of the following:
• Select the site model, and click Recreate from Source Data from the Object Info palette.
• Right-click on the site model and select Edit from the context menu, or select Modify > Edit Site Model. From the Choose Component dialog box, select Recreate from Source Data.
• Alternatively, right-click on the site model and select Recreate from Source Data from the context menu.
2 Changes can be made to the source data, and the source data can be validated (see Validating 3D Source Data).
3 Return to the site model by clicking Exit Recreate from Source Data at the top right of the drawing window. The site model updates automatically, reflecting any source data changes.
~~~~~~~~~~~~~~~~~~~~~~~~~
 Updating
a Site Model
Updating
a Site ModelCommand |
Path |
|---|---|
Update |
Context menu |
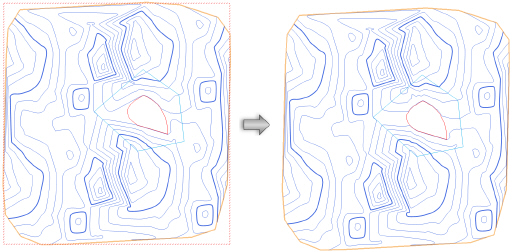
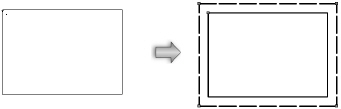
If a site modifier object is moved or modified on any layer, the site model displays with a red and white striped border to indicate that the site model requires updating.
To update the selected site model:
1 Select the site model.
2 Select the command, or click Update from the Object Info palette.
3 The selected site model is updated.
If the update causes the site model contours to fall outside the minimum/maximum elevation range specified in the site model settings, an alert displays, allowing the range to be adjusted.
~~~~~~~~~~~~~~~~~~~~~~~~~
 Cropping
a Site Model
Cropping
a Site ModelCommand |
Path |
|---|---|
Edit Site Model Crop |
Context menu |
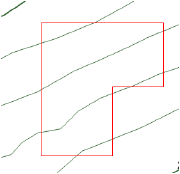
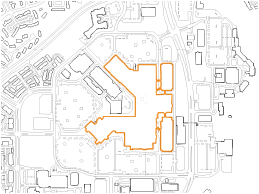
The site model can be cropped by a custom site border shape. This allows you to limit the area of the site model, without permanently excluding the original extents of the source data. The original site model can easily be restored by editing the site model crop object.
To crop a site model:
1 Select the command.
Alternatively, click Edit Site Model Crop from the Object Info palette.
2 In site border editing mode, any existing site border object is selected. Move the site border, or use the Reshape tool to reshape (edit) the site border object; see Remodelando Objetos. The site border object can also be deleted and a new site border object can be created from any closed 2D shape.
To remove the cropping from a site model, delete the site border object. This restores the site model to its original bounds.
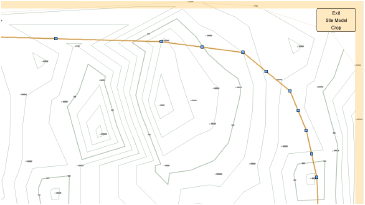
3 When the site border is ready, click the Exit Site Model Crop button (or select Modify > Exit Site Model Crop) to return to the drawing.
4 The site border crops the site model object.
With the Draw Site Border option selected in the site model settings, the site border displays in Top/Plan view. Adjust the color of the site border in the graphic properties of the site model settings.
~~~~~~~~~~~~~~~~~~~~~~~~~
 Reshaping
the Site Model Border
Reshaping
the Site Model BorderMode |
Tool |
Tool set |
|---|---|---|
Edit Site Model Crop |
Reshape
|
Basic |
The edge of a selected site model displays a crop or border (select Draw Site Border in the Site Model Settings to draw a 2D polygon on the edge of the site model in Top/Plan view). In Vectorworks Architect or Landmark, the Reshape tool reshapes the crop. This is similar to editing the site model crop object as described in Cropping a Site Model.
To reshape the site model crop:
1 Select the site model.
2 Click the tool and mode.
3 Reshape the site model crop as described in Remodelando Objetos. Crop vertices can be repositioned, added, and deleted.
The site model crop is immediately reshaped. No updating is necessary.

~~~~~~~~~~~~~~~~~~~~~~~~~
 Editing Site Model Contours
Topographic contours of the existing or proposed site model can be directly edited, added, and deleted, so that the site can be modified, graded, and shaped per the design requirements.
In addition to modifying contours, you can change the site model shape by Sculpting the Site Model Terrain.
Do not edit the portion of a contour that is within the bounds of a site modifier. The changes would be undone when exiting the editing mode, because the site modifier’s effects on the site model take precedence over the contour edits.
If edits are planned for both the existing and proposed site models, edit the existing site model contours first. If you edit the proposed site model first in the affected area, the edits could be inadvertently changed or undone by the edits to the existing site model.
|
Click here for a video tip about this topic (internet access required). |
Command |
Path |
|---|---|
• Edit Existing Site Model Contours • Edit Proposed Site Model Contours |
Context menu |
Contour editing of either the existing or proposed site model is possible within contour editing mode.
To access the contour editing mode:
1 Select the relevant command for the site model.
Alternatively, select the site model and click either Edit Existing Site Model Contours or Edit Proposed Site Model Contours from the Object Info palette, or select the Edit context menu command, and click the relevant editing mode from the Choose Component dialog box.
2 In contour editing mode, a subset of available tools displays in a special Contour Edit palette. This palette is only available within the contour editing mode.
Depending on the original view, the site model displays with either 2D or 3D contours while in the editing mode. Contour label positions are locked so that they are not inadvertently moved or edited. Site modifiers are visible, but they cannot be selected or edited.
3 When the contours are edited, click the Exit Existing Site Model Contours or Exit Proposed Site Model Contours button (or select the identically-named commands from the Modify menu) to apply the changes and return to the drawing.
Any site modifiers are reapplied to the site model.
The properties of a selected site model contour can be edited from the Object Info palette. The Contour Edit palette tools can also edit the contour.
To edit a site model contour:
1 In site model contour editing mode, click the Selection tool from the Contour Edit palette.
2 Click on a site model contour to select it.
3 Move the contour with the mouse or nudge it; the contour location can be adjusted in the X or Y direction only. Change the contour Elevation from the Object Info palette.
4 A contour, and the vertices of a contour, can be reshaped with the Reshape tool, or edited with the other tools available from the Contour Edit palette. In most cases, the contour should not cross another contour, and no segment of a contour should be collinear with another contour’s segment (occupying the same space in the XY plane).
To remove a selected contour, press the Delete key.
Tool |
Tool set |
|---|---|
Site Model Contour
|
Contour Edit palette |
The Site Model Contour tool adds a contour to the existing or proposed site model.
The following modes are available.

Mode |
Description |
|---|---|
Lock Elevation |
Toggles the availability of the Elevation entry mode |
Elevation |
When Lock Elevation mode is unlocked, enter an elevation value for the site model contour; otherwise the elevation is obtained by clicking on the site model |
Polyline creation options |
Selects the method for drawing the polyline upon which the site model contour is based; see Creating Polylines |
To add a site model contour:
1 In site model contour editing mode, click the tool.
2 To draw a contour at a specific elevation, toggle Lock Elevation mode to enable data entry and specify the Elevation value.
The contour Elevation can also be specified from the Floating Data bar.
A convenient way of helping you determine the correct elevation for the new contour is to disable Lock Elevation mode and click on the site model where the contour will be created. Press the Tab key to view the Elevation of that point displayed in the Floating Data bar, and click to start drawing the contour line. Then, enable Lock Elevation mode and enter the desired Elevation of the contour.
3 Draw the polyline to represent the contour. In most cases, the contour should not cross another contour, and no segment of a contour should be collinear with another contour’s segment (occupying the same space in the XY plane).
4 Double-click to finish drawing the contour.
After exiting the contour editing mode, the contour polyline is automatically converted to a polygon, segmented according to the Segmentation Length value specified in the Site Model Settings. If necessary, new contours are inserted and interpolated. The existing and proposed site models are updated.
~~~~~~~~~~~~~~~~~~~~~~~~~
 Editing
Contour Labels
Editing
Contour LabelsMode |
Tool |
Tool set |
|---|---|---|
Edit Site Model Label Position |
Reshape
|
Basic |
Normally, contour labels are distributed along the major contour lines at regular intervals. Occasionally, this is not desirable and a label needs to be moved. When a site model is selected, two additional modes are available for the Reshape tool. These modes allow the contour labels to be repositioned, added, and removed.
Show labels must be selected in the Site Model Settings dialog box.
To change the font size of the contour labels, set the size from the Text > Size menu.
To edit contour labels:
1 Select the site model.
2 Click the tool and mode.
Each label on the contours of the site model displays with a control point.

3 Click a tool mode to move, add, or delete label handles.

Only one contour label can be edited at a time. The Reshape tool marquee modes have no effect on contour label operations. See Remodelando Objetos for more information.
If the site model changes later, the relative label positions are preserved, reducing the need to reposition them again.
~~~~~~~~~~~~~~~~~~~~~~~~~
 Sculpting
the Site Model Terrain
Sculpting
the Site Model TerrainThere are several methods for changing the site model’s terrain. The topographic contours of a site model can be modified by Editing Site Model Contours, and the site model surface can be modified with the addition of site modifiers as described in Site Model Modification Overview. However, for directly manipulating the site model in 3D by sculpting, use the sculpting tools.
The sculpting tools can push and pull the existing or proposed site model surface up and down, while specifying the range of affected site model vertices for either large-scale or a fine degree of manipulation. You can also create swales or berms, and add vertices. The tools are available from the Surface Sculpting palette, which is only visible when in an editing mode for the existing or proposed surface.
Do not edit the portion of a surface that is within the bounds of a site modifier. The changes would be undone when exiting the editing mode, because the site modifier’s effects on the site model take precedence over the surface edits.
If edits are planned for both the existing and proposed site models, edit the existing site model surface first. If you edit the proposed site model first in the affected area, the edits could be inadvertently changed or undone by the edits to the existing site model.
~~~~~~~~~~~~~~~~~~~~~~~~~
 Surface Sculpting
Mode
Surface Sculpting
ModeCommand |
Path |
|---|---|
• Edit Existing Site Model Surface • Edit Proposed Site Model Surface |
Context menu |
Sculpting of either the existing or proposed site model is possible within surface sculpting mode.
To access the surface sculpting mode:
1 Select the relevant command for the site model.
Alternatively, select the site model and click either Edit Existing Site Model Surface or Edit Proposed Site Model Surface from the Object Info palette, or select the Edit context menu command, and click the relevant editing mode from the Choose Component dialog box.
2 In surface sculpting mode, a subset of available tools displays in a special Surface Sculpting palette. This palette is only available within the surface sculpting mode.
If the original site model view was Top/Plan, the view changes to Top view, but otherwise, the view remains unchanged. The site model’s appearance or rendering may temporarily change to maximize editing, but will revert to the original appearance and view when exiting the editing mode. Site modifiers are visible, but they cannot be selected or edited.
3 When the surface is sculpted, click the Exit Existing Site Model Surface or Exit Proposed Site Model Surface button (or select the identically-named commands from the Modify menu) to apply the changes and return to the drawing.
Any site modifiers are reapplied to the site model.
~~~~~~~~~~~~~~~~~~~~~~~~~
 Sculpting
the Site Model Surface
Sculpting
the Site Model SurfaceTool |
Tool set |
|---|---|
Sculptor
|
Surface Sculpting |
The Sculptor tool performs a push/pull operation on a specific portion of the site model surface, in a vertical direction.
The following modes are available.

Mode |
Description |
|---|---|
Single Element Selection |
Selects a single TIN element (triangle, edge, or vertex) and its defining elements (the edges and vertices that make up the triangle, or vertices on either side of the edge) for sculpting. Immediately adjacent vertices and faces are also affected. |
Radius Selection |
Selects an area for sculpting that is defined by the Radius value |
Radius |
Determines the extent of the effects on the site model surface when in Radius Selection mode |
Soft Selection (Radius Selection only) |
Toggles whether soft selection is used for the sculpting operation. Soft selection affects vertices in the center of the operation the most, with a gradual falloff of the effect (according to the Falloff value), for a natural, rounded modeling operation. When Soft Selection is enabled, the amount of falloff, and therefore, the degree of the sculpting operation’s effect, is indicated by colored vertices. The closer the color is to red, the more effect the sculpting operation will have on that portion of the surface. As the colors move along the spectrum towards blue, this indicates that the elements are less fully selected, and will not move as much. When Soft Selection is disabled, all of the vertices within the radius are affected by the sculpting operation to the same degree, and all of the affected vertices display in red. |
Falloff |
Sets the degree of soft selection, from 0 – 100%. A higher value will result in a more gentle falloff of the sculpting effect when Soft Selection is enabled. A lower value will result in a sharper, more narrow area being affected. |
Tessellation (Radius Selection only) |
Toggles whether tessellation is on or off. This effect automatically increases the number of vertices and therefore, the level of detail, as the site model is sculpted, according to the Max Distance value. More tessellation increases the number of created vertices and edges, allowing detailed sculpting to occur in areas where currently, a low level of detail exists. [blue triangles may change according to bug VB-151067 AD 7/18]
|
Max Distance |
Specifies the amount of tessellation to use by setting the distance at which to insert vertices. Vertices are inserted until all edges in the affected area conform to the distance value; a higher relative distance value will add less tessellation, or amount of detail. Entering a short distance may slow down the sculpting operation and could impact the overall site model performance. |
To sculpt the site model surface:
1 In site model Surface Sculpting Mode, click the tool.
2 Select the desired mode depending on the site model conditions and the desired outcome.
• Click Single Element Selection to only move a single selected vertex, edge, or face. Directly adjacent elements are also affected.
• Click Radius Selection mode and specify a Radius to sculpt a larger area, affecting many elements at once.
• In Radius Selection mode, toggle Soft Selection on or off depending on the degree to which elements within the radius should be affected, and set the Falloff value when it is enabled.
• In Radius Selection mode, toggle Tessellation mode on to create additional vertices and edges as the sculpting occurs, and specify a Max Distance value when it is enabled.
3 As the cursor moves over the site model surface, its elements (vertices, edges, or faces) are highlighted. Click on a site model vertex, edge or face; the effect of the operation, and the radius in Radius Selection mode, varies slightly depending on which element is selected. Selecting an edge or face also selects its associated vertices, and the operation will affect the adjacent face sizes. The operation occurs only in a vertical direction.
4 Click to begin the sculpting operation, and drag to move the selected site model element up or down vertically. The cursor changes to a double-headed arrow. Move the cursor to expand or subtract from the surface of the terrain. The distance can also be specified by entering a positive or negative value in the Distance field in the floating data bar. The results preview on the drawing; a black dot temporarily indicates the original starting point for reference.

5 Click to complete the sculpting operation.
The minimum and maximum contour elevations may need adjustment to accommodate the new site model shape; if so, an alert opens. Normally, you want all the contours to be visible, so click Yes.
~~~~~~~~~~~~~~~~~~~~~~~~~
 Adding a
Site Model Surface Vertex
Adding a
Site Model Surface VertexTool |
Tool set |
|---|---|
Add Vertex
|
Surface Sculpting |
In areas of a site model without much detail, inserting a vertex is useful. The new vertex, and the faces it adds, can then be sculpted with the Sculptor tool. Adding vertices is similar to the Tessellation mode of the Sculptor tool, except that you choose where to add the detail.
To add a vertex to the site model surface:
1 In site model Surface Sculpting Mode, click the tool.
2 Click on the site model surface to insert a vertex (on a face or edge).

~~~~~~~~~~~~~~~~~~~~~~~~~
 Creating a Swale or Berm on the
Site Model Surface
Creating a Swale or Berm on the
Site Model SurfaceTool |
Tool set |
|---|---|
Swale/Berm
|
Surface Sculpting |
The Swale/Berm tool creates swales (depressions) or berms (mounds) on the site model, using a defined linear shape.
The following modes are available.

Mode |
Description |
|---|---|
Width |
Sets the width of the land feature at the point where it meets the site model surface |
Depth/Height |
Specifies the depth (for swales) or height (for berms); a negative value creates a swale, and a positive value creates a berm |
Profile |
Select a general shape for the land feature
|
Follow Terrain |
Toggles the ability of the elevation at the top of the land feature to either follow the elevation of terrain where it is placed, or simply to smoothly slope the top of the feature from starting to ending points of the polyline
|
Polyline creation options |
Selects the method for drawing the polyline upon which the swale or berm is based; see Creating Polylines |
To create a swale or berm on the site model surface:
1 In site model Surface Sculpting Mode, click the tool.
2 Specify the size of the feature, and select a polyline mode. Select a Profile shape for the land feature, and toggle Follow Terrain on or off.
Not following the terrain could result in a swale that actually rises above the surrounding terrain in certain areas, or a berm that acts as a swale.
3 Draw the polyline to represent the swale or berm.
4 Double-click to finish drawing the feature.
~~~~~~~~~~~~~~~~~~~~~~~~~
 Creating
a Site Model Snapshot
Creating
a Site Model SnapshotCreating a snapshot of the site model allows several display styles of the site model to be viewed at one time. The snapshot views cannot be edited directly; however, if the original site model is modified, the changes apply to all related snapshots automatically upon updating. Snapshots can be from a Top/Plan or 3D view of the site model; 3D snapshots can be rendered.
To create a site model snapshot:
1 Set the properties of the site model for the snapshot. The snapshot’s appearance is based on the current site model settings, and its location is based on the original source data.
2 From the Object Info palette of a selected site model, click Create a Snapshot.
3 The snapshot is created on the active layer, over the original site model. The Object Info palette of a selected snapshot displays the parameters of the original site model, and cannot be changed for the snapshot (with the exception of the display units).
4 Any changes to the original site model are reflected in associated snapshots when clicking Update from the Object Info palette of the selected original site model.
~~~~~~~~~~~~~~~~~~~~~~~~~
 Sending Objects to the Site Model Surface
Command |
Workspace: Path |
|---|---|
Send to Surface |
• Architect: AEC > Terrain • Landmark: Landmark |
Trees, parking areas, retaining walls, site retaining modifiers, irrigation, and other site objects may need to be placed on the surface of the model. For this purpose, use the Send to Surface command.
This command is effective for stakes, 3D loci, 3D polygons, 3D primitives, extrudes, sweeps, meshes, slabs, light objects, walls, and symbols with a 3D component. If a 2D polyline or 2D polygon is selected, it will first be converted into its 3D equivalent before being sent to the surface.
To send an object to the surface:
1 Make the layer with the site model object the active layer.
2 Place the object on the active layer plane and move it to the desired location on the site model.
3 Select the command.
Alternatively, right-click on the object and select the context command (Vectorworks Landmark required).
4 If the object is a retaining wall or pad with retaining edge site modifier, the Send to Surface dialog box opens. Select the method of sending the object to the surface of the site model.
► Click to show/hide the parameters.
5 The correct Z value is given to the object’s insertion point, bottom-most point, or specified portion, placing the object on the surface of the site model.
~~~~~~~~~~~~~~~~~~~~~~~~~
 Site
Model Modification Overview
Site
Model Modification Overview
The Site Modifiers tool is in the Site Planning tool set.
As discussed in Conceito: Sitework Overview, when the site model is generated, two different display modes of the site model object are available—existing and proposed. The existing site represents the site prior to your project; the proposed site incorporates the project’s changes. To modify the site model, use the Site Modifiers tool, along with other site modification tools in the Vectorworks program; a site modifier can be applied to either the existing or proposed site model.
The Site Modifiers tool has several modes.

Mode |
Description |
|---|---|
Grade Limit |
Defines an area of topographical transition between existing site data and the site modifiers enclosed within the limits |
Contour |
Creates an open path site modifier |
Pad |
Draws a closed area which modifies the site model |
Pad with Retaining Edge |
Creates a pad with an edge around it, allowing the terrain to be shaped around the pad |
Texture Bed |
Creates an area of the site model that can be textured |
Spoil Pile |
Creates an area where excess earth can be used to help balance the cut and fill |
Snap to Contour Elevation |
Constrains the site modifier to the site model contour elevation under the cursor when the site modifier is created. The contour under the cursor is highlighted, and the elevation of that contour is used as the modifier elevation. |
Polyline creation options |
Selects the method for drawing the polyline upon which the site modifier is based; see Creating Polylines. |
Preferences |
Sets the default preferences for the site modifier |
Pad Elev |
When creating a pad, pad with retaining edge, contour, or spoil pile, specify the elevation of the site modifier |
Site modifiers can be placed on any layer. The site model properties specify whether modifiers in another layer can affect the site model (see Creating the Site Model). You might put various site modifiers on separate layers, for example, so that you can show each modifier’s effect on the site model individually. When a site modifier is placed in the drawing, the Site-DTM-Modifier class is created automatically.
In addition to the site modifiers that are created with the Site Modifiers tool, a number of other tools and commands create objects that can modify the site model.
~~~~~~~~~~~~~~~~~~~~~~~~~
 Creating
a Pad or Pad with Retaining Edge
Creating
a Pad or Pad with Retaining EdgeMode |
Tool |
Tool set |
|---|---|---|
• Pad • Pad with Retaining Edge |
Site Modifiers
|
Site Planning |
A pad is a 3D polygon representing the shape of an element which is to be added to, and normally modifies, the site model.
A pad with a retaining edge is similar to a regular pad site modifier, but it includes an additional configuration that defines an edge around the pad, allowing the terrain to be shaped around the pad. For example, the retaining edge can be used to adjust the terrain around a hardscape, offering precise control over the cut and fill amounts.
The modifier can be applied to the existing or proposed site model; the site model is modified when the site model is updated. Draw a pad with the Site Modifiers tool, or draw a polyline and then select the Create Objects from Shapes command to change it to a pad or pad with retaining edge object (see Creating Objects from Shapes).
To create a pad or pad with retaining edge:
1 Click the tool and mode. Specify the pad elevation from the Tool bar if desired.
2 Draw the pad object. Pads can be drawn closed or open (open pads are sometimes called “break lines”).
3 If the pad is sloping, specify the slope properties in the Object Info palette and/or by adjusting slope indicator control points and reshaping the modifier corners.
• Select the method of defining the slope from the Slope Def list in the Object Info palette, and specify the slope parameters. The slope parameters do not display for a Slope Def of None. As values are entered in the Object Info palette, the other parameters are automatically calculated and displayed.
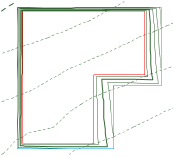
• A banked slope can be contoured. The reference elevation control point indicates the start elevation of the site modifier, and the dashed line that passes through the reference elevation control point represents a constant elevation along the line. The dashed line indicates and controls the Contour Angle in the Object Info palette; it is only visible when the modifier is selected with the Selection tool, and it does not print. All the points on the line are at the same elevation; move the contour angle control points to define how the site modifier is banked along the pad slope. The contour angle must always be between 1 and 90 degrees of the slope vector (the banked contour cannot be parallel or perpendicular to the pad slope).
• In addition to the pad slope, up to two custom slope axes can be specified: Slope A and Slope B. Slope arrows can be displayed on the pad to indicate the slope angles of the main slope and the two custom axes; select Show Slope, Show Slope A, and/or Show Slope B. The slope arrows are interactive; move a control point to adjust the slope direction, and the slope at that location is displayed. The control points of the slope arrows are only visible when the modifier is selected with the Selection tool, and they do not print.
• The Object Info palette displays the Elevation at End so that pads that meet at the bottom of a slope can be set to the same ending elevation. The planes for two site modifiers match when their contour lines are parallel, and the starting point of one modifier is on the plane of the other modifier.
• In Top/Plan view, select the control points of the slope arrows or the contour angle indicator, to interactively display the slope at that location. Changes to the slope values in the Object Info palette affect all the slope parameters. To set the slope plane, change the slope and the contour angle, or change slope A and slope B.
• In Top/Plan view, the Reshape tool changes the shape of the pad. In a 3D view, use the Reshape tool to adjust the elevation at the corners of the site modifier. This changes the bank of the plane and modifies the contour angle and possibly other corners of the modifier, but does not modify the slope value. This interactive adjustment makes it easier to match two site modifiers so they meet at the same elevation.

4 Normally, create grade limits around the pad. The pad properties can be edited from the Object Info palette.
The Site Modifiers tool generates a 3D pad polygon modifier that is always planar.

► Click to show/hide the parameters.
5 For a pad with retaining edge, the retaining edge modifier is drawn separately, and it can be used to control the depression around the pad. Reshape the retaining edge either from the Object Info palette or with the Reshape tool.
• The Object Info palette vertex parameters include the ability to edit the Z value of the selected retaining modifier vertex or retaining modifier edge.
• The retaining edge site modifier can be reshaped with the Reshape tool, similar to reshaping walls (see Reshaping Walls). Move vertices, and add or delete vertices to reshape the retaining edge.

• The Send to Surface command can be used to send either the retaining modifier edge or the pad to the surface of the site model.
6 To reflect the pad modification, select the site model and click Update from the Object Info palette.

For predictable results, pads should not overlap. All pads should be either completely inside or completely outside of all grade limits. Pads, including those that may be incorporated into plug-in objects (such as landscape walls) cannot cross outside the grade limits.
~~~~~~~~~~~~~~~~~~~~~~~~~
 Creating a Contour
Mode |
Tool |
Tool set |
|---|---|---|
Contour |
Site Modifiers
|
Site Planning |
A contour is an open 3D polygon which modifies the site model, and represents a contour line at a constant elevation. The modifier can be applied to the existing or proposed site model; the site model is modified when the site model is updated. Draw a contour with the Site Modifiers tool, or draw a polyline and then select the Create Objects from Shapes command to change it to a pad object (see Creating Objects from Shapes).
The recommended method of creating and editing contours is by Editing Site Model Contours.
To create a contour:
1 Click the tool and mode. Specify the pad elevation from the Tool bar if desired.
2 Draw the contour object.
The properties can be edited from the Object Info palette.
Normally, a contour site modifier does not have a slope since it indicates constant elevation. In rare cases when the modifier is sloping, specify the slope value; a slope arrow indicates the direction of the slope. The start of the slope arrow indicates the zero elevation point of the sloping contour. Select the control points of the slope arrow to move either end. Deselect Show Slope to hide the slope arrow.
► Click to show/hide the parameters.
3 Normally, create grade limits around the contour.
4 To reflect the contour modification, select the site model and click Update from the Object Info palette.

~~~~~~~~~~~~~~~~~~~~~~~~~
 Creating
Grade Limits
Creating
Grade LimitsMode |
Tool |
Tool set |
|---|---|---|
Grade Limits |
Site Modifiers
|
Site Planning |
Grade limits define the area of topographical transition between existing site data and the site modifiers enclosed within the grade limits; they can be thought of as a “limit of construction.” Outside the grade limits, the site remains unchanged; within the grade limits, the site model is defined by the pads. Grade limits can overlap, but cannot completely enclose, another grade limit area. Grade limits should not cross a pad or spoil pile.
Grade limits are created automatically around certain site modifiers, such as massing models. Grade limits can also be created automatically from pads (Vectorworks Landmark required). To draw grade limits manually, use the Site Modifiers tool, or draw a polyline and then select the Create Objects from Shapes command (see Creating Objects from Shapes).
To create grade limits:
1 Click the tool and mode.
2 Draw the grade limit area around a site modifier, such as a pad.

The properties can be edited from the Object Info palette.
► Click to show/hide the parameters.
3 To reflect the grade limit modification, select the site model and click Update from the Object Info palette.
~~~~~~~~~~~~~~~~~~~~~~~~~
 Creating Grade
Limits Automatically
Creating Grade
Limits AutomaticallyCommand |
Workspace: Path |
|---|---|
Create Grade Limits from Pad |
• Designer: AEC > Terrain • Landmark: Landmark |
Because grade limits are often associated with a pad or other type of site modifier, the Vectorworks Landmark product can create grade limits automatically around a site modifier, based on specific parameters. Grade limits can be created with a gradual sloping transition from the existing site contours to the modifier, placed at a variable or fixed distance from the modifier. The grade limits cut and fill the site model to create a constant slope (batter slope).
To create grade limits automatically around one or more site modifiers:
1 Select the site modifiers which require the grade limits. Valid modifiers include pads, road objects, massing models, and landscape walls.
2 Select the command.
The Create Grade Limits from Pad dialog box opens. Select the grade limit parameters.
► Click to show/hide the parameters.
3 To reflect the grade limit modification, select the site model and click Update from the Object Info palette.

~~~~~~~~~~~~~~~~~~~~~~~~~
 Creating a
Pad from Grade Limits
Creating a
Pad from Grade LimitsCommand |
Workspace: Path |
|---|---|
Create Pad from Grade Limits |
• Designer: AEC > Terrain • Landmark: Landmark |
With Vectorworks Landmark, a pad modifier can automatically be created within defined grade limits. The pad is placed so that the cut and fill amounts of the underlying proposed site model are set equally, helping site designers start with a balanced solution. Batter slope angles can be different on the different sides of the modifier.
Certain restrictions apply when creating the pad:
• The polygon that defines the grade limit area must be closed. If more than one grade limit area is selected, all the grade limit polygons must be closed. (To close the polygon, select the grade limit and then select Closed from the Object Info palette.)
• If more than one grade limit is selected, the created pads must have a uniform batter slope. To set the batter slopes individually, select only one grade limit object at a time.
• The grade limit area must be fully enclosed within a site model.
• The specified batter slope or slopes cannot be too small to create the pad; slope values that are too low prevent balanced cut and fill.
To create a pad automatically from the grade limits:
1 Select one or more grade limit objects.
2 Select the command.
The Create Pad from Grade Limits dialog box opens, and if necessary, the view temporarily changes to optimally display the area. Specify a uniform batter slope for the entire pad, or scroll with the Prev and Next buttons to set the slope individually for each side of the pad. The slope values must be greater than 0 but less than 90 degrees.
► Click to show/hide the parameters.
The resulting pad modifier is created and selected.
Individual slope values are retained for each grade limit object. The values can be reused for the creation of a new pad by selecting the grade limit object, and then selecting Create Pad from Grade Limits again.

~~~~~~~~~~~~~~~~~~~~~~~~~
 Creating
a Spoil Pile Area
Creating
a Spoil Pile AreaMode |
Tool |
Tool set |
|---|---|---|
Spoil Pile |
Site Modifiers
|
Site Planning |
A spoil pile refers to an area where excess earth is used to help balance the cut and fill, so that the site does not require earth to be moved in or out. A spoil pile area applies an even thickness of cut or fill for the site. To create a spoil pile, either use the Site Modifiers tool, or draw a polyline and then select the Create Objects from Shapes command (see Creating Objects from Shapes).
To create a spoil pile area:
1 Create the site model and add any modifiers, such as pads and roads, and update the proposed site model by clicking Update from the Object Info palette of the selected site model.
2 The initial cut and fill volumes are displayed in the Object Info palette.
3 Click the tool and mode. Specify the pad elevation from the Tool bar if desired.
4 Draw the spoil pile area.
5 In the Object Info palette, adjust the elevation of the spoil pile up or down depending on whether fill is required or excess fill is present.
► Click to show/hide the parameters.
6 Select the site model and click Update from the Object Info palette.

7 With the site model still selected, click Update Cut and Fill Calculations from the Object Info palette.
Evaluate the results of the spoil pile by checking the Net C&F Volume results in the Object Info palette of the selected site model. If the spoil pile elevation needs adjustment, select the spoil pile and enter a new Elevation value from the Object Info palette. Then select the site model, click Update, and then click Update Cut and Fill Calculations.
8 Continue adjusting the spoil pile elevation until a balanced cut and fill volume is achieved.
Display the 3D cut and fill volumes by selecting Cut and Fill as the 3D Display from the Object Info palette of a selected site model. The cut and fill colors are specified on the Site Model tab of the Graphic Properties dialog box. In addition, a 2D polygonal representation of the cut and fill area can be displayed by selecting 2D Cut & Fill Area from the Site Analysis tab.
~~~~~~~~~~~~~~~~~~~~~~~~~
 Creating
a Texture Bed
Creating
a Texture BedMode |
Tool |
Tool set |
|---|---|---|
Texture Bed |
Site Modifiers
|
Site Planning |
The texture bed site modifier can convert a 2D polygon into an area of the drawing that can be textured. For example, texture a lawn with grass, a terrace with bricks, or a sand trap with sand for a photorealistic rendered appearance. To draw a texture bed, either use the Site Modifiers tool, or draw a polyline and then select the Create Objects from Shapes command (see Creating Objects from Shapes).
To create a texture bed:
1 Click the tool and mode.
2 Draw the texture bed.
The properties can be edited from the Object Info palette.
► Click to show/hide the parameters.
See Textures and Shaders for more information on textures.
3 To reflect the texture bed modification, select the site model and click Update from the Object Info palette.
4 Render the model with a Renderworks render mode to see the texture bed.

Images can be mapped to the surface of the site model; for example, use an aerial image of the site. Unlike the texture bed, which is a site modifier, mapping of an image texture occurs from the Render tab of the Object Info palette, and is adjusted with the Attribute Mapping tool.
To map images on the site model:
1 Create an image texture as described in Creating Image-based Shaders.
2 Select the site model. From the Object Info palette, select the image texture from the Texture list on the Render tab.
3 Switch to a 3D view from the Views > Standard Views menu, and render the site model to view the mapped image.
4 Click the Attribute Mapping tool from the Visualization tool set to position, move, resize, and rotate the image texture. Mapping adjustments are constrained to the 2D texture space plane; the image cannot be skewed or tilted.
~~~~~~~~~~~~~~~~~~~~~~~~~
 Creating
a Massing Model
Creating
a Massing ModelTool |
Tool set |
|---|---|
Massing Model
|
Site Planning |
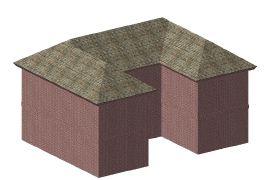
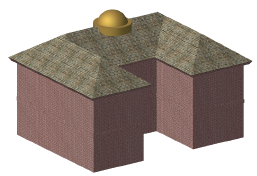
The Massing Model tool creates a building shell for illustrative purposes. This is an easy way to create a representative or context building when a detailed building is not required. Building models can also be created by drawing a polyline and then selecting the Create Objects from Shapes command (see Creating Objects from Shapes). A massing model can be a site modifier.
To create a massing model:
1 Click the tool.
The Massing Model tool and Campanile tool share the same position on the tool set. Click and hold the mouse on the visible tool to open the Ferramentas Pop-out list and select the desired tool.
2 Click to begin drawing the outline of the building. Continue clicking to draw the shell polyline. Double-click, or click once at the start point, to end the polyline.
3 The massing model parameters can be edited from the Object Info palette.
► Click to show/hide the parameters.
4 If the massing model is used as a site modifier, the proposed site model requires updating. Select the site model and click Update from the Object Info palette.
|
Click here for a video tip about this topic (internet access required). |
~~~~~~~~~~~~~~~~~~~~~~~~~
 Creating
a Custom Massing Model Roof
Creating
a Custom Massing Model RoofTool |
Tool set |
|---|---|
Massing Model
|
Site Planning |
If the standard flat or pitched massing model roof is not sufficient for portraying a more specific type of model, the geometry that is the basis of the massing model roof can be customized.
To create a custom massing model roof:
1 Create the massing model as described in Creating a Massing Model.
2 Select Use Custom Roof from Profile from the Object Info palette.
3 Select Modify > Edit Massing Model to enter roof profile editing mode.
In this mode, you see the geometry that is used to create the custom roof. The first roof created by the object is used as the default custom roof geometry. If the number of stories has changed since the roof was first created, the height of the custom roof geometry needs to be manually adjusted.
Deleting the existing custom roof geometry causes a copy of the current standard roof, pitched or flat, to be placed in the group when the group is exited.
The geometry can be selected and modified by standard editing methods used in the Vectorworks program; see Editing Objects. The Reshape tool can also be used.
Pitched roof geometry is treated similarly to a roof object; edit its parameters as described in Editando Parâmetros de Objetos de Telhados Básicos. Eaves can be changed to gables, for example.
The geometry of a pitched roof can be further edited by selecting Modify > Edit Group and creating cut-outs; see Criando Recortes em um Telhado. Geometry can be added to the roof (a dome or cupola), or subtracted from the roof using 3D tools. Click the Exit Group button (or select Modify > Exit Group) to return to the roof profile editing mode.
4 When the roof edits have been made, click the Exit Profile button (or select Modify > Exit Profile) to return to the drawing.
Changes to the massing model may require manual updates to the custom roof; select the massing model and select Modify > Edit Massing Model to make any changes.
~~~~~~~~~~~~~~~~~~~~~~~~~
 Creating Roads
The Vectorworks Architect and Landmark products offer a variety of different tools and commands for creating roads, depending upon the complexity of the roadway. A road object can be set to be a site model modifier, and changes the proposed site model when the site model is updated.
Multiple roadway tools share the same position on the tool set. Click and hold the mouse on the visible tool to open the Ferramentas Pop-out list and select the desired tool.
• The Roadway (Poly) tool is the most straightforward, yet flexible way of creating a roadway in the Vectorworks Architect and Landmark products.
• The Roadway (Custom Curb) tool joins roadways for Vectorworks Architect and Landmark users. This tool can model exits, merges, traffic circles, intersections, cul-de-sacs, dead ends, and more.
• The Roadway (NURBS) tool offers an alternative way of inserting a road on a site model, and is available in both the Vectorworks Architect and Landmark products.
• The Vectorworks Landmark product includes commands that create a roadway from a polyline in several steps, with complete control over each step.
• For simple roadway representations in the Vectorworks Architect and Landmark products, build sections of a road with the Roadway (Straight) and Roadway (Curved) tools, and connect them with the Roadway (Tee) tool.
~~~~~~~~~~~~~~~~~~~~~~~~~
 Creating
Polyline Roadways
Creating
Polyline RoadwaysMode |
Tool |
Tool set |
|---|---|---|
Modes for the Polyline Tool |
Roadway (Poly)
|
Site Planning |
The Roadway (Poly) tool creates a road defined by a path polyline or polygon. In Top/Plan view, the curbs and pavement are represented by filled polygons. In 3D views, extrudes are generated to represent the curbs and pavement. Polyline roadways can also be created by drawing a polyline or polygon and then selecting the Create Objects from Shapes command (see Creating Objects from Shapes).
To create a road with the Roadway (Poly) tool:
1 Click the tool.
Multiple roadway tools share the same position on the tool set. Click and hold the mouse on the visible tool to open the Ferramentas Pop-out list and select the desired tool.
2 Click to begin drawing the roadway polyline path; click to set each polyline vertex. Click again back at the start point (or press K) to complete a closed polyline, or double-click to create an open path polyline. For more information on polylines, see Creating Polylines.
The first time you use the tool in a file, a properties dialog box opens. Set the default properties. The properties can be edited from the Object Info palette.
► Click to show/hide the parameters.
3 If necessary, use the Reshape tool to modify the locations of the vertices after object creation, or use the vertex editing controls from the Object Info palette to move the vertices, or change the elevation of station points.
4 Select the site model and click Update from the Object Info palette.
~~~~~~~~~~~~~~~~~~~~~~~~~
 Joining Roadways
with a Custom Curb
Joining Roadways
with a Custom CurbTool |
Tool set |
|---|---|
Roadway (Custom Curb)
|
Site Planning |
The Roadway (Custom Curb) tool creates sections of roadways that join other roadways in various ways, such as intersections, exits, merges, traffic circles, cul-de-sacs, dead ends, and more.
The tool creates a free-form roadway shape that is extremely flexible, and can be reshaped to fit the needs at the particular location. The curb can be hidden along the sides of the roadway object, where it connects to other roadways.
Custom curb roadways can also be created by drawing a polyline or polygon and then selecting the Create Objects from Shapes command (see Creating Objects from Shapes).
To create a custom curb roadway:
1 Click the tool.
Multiple roadway tools share the same position on the tool set. Click and hold the mouse on the visible tool to open the Ferramentas Pop-out list and select the desired tool.
2 Click to set the starting point of the roadway. Click again to set the ending point. These clicks determine the initial length and orientation of the curb roadway. When selected, the roadway displays with two control points which define the length and orientation.

3 Use the Reshape tool to reshape the curb roadway as described in Remodelando Objetos. Roadway vertices can be repositioned, added, and deleted; however, the two control points that define the roadway cannot be reshaped. The Change Vertex mode of the Reshape tool can switch vertices to arc vertices to use curves in the curb roadway. The Hide or Show Edges mode of the Reshape tool can hide and show the portions of the curb where the roadway intersects with other roadway objects.
The curb roadway can be reshaped while in path editing mode. Select Modify > Edit Roadway (Custom Curb), or right-click on the curb roadway and select Edit Path from the context menu.

4 The Roadway (Custom Curb) parameters can be edited from the Object Info palette.
► Click to show/hide the parameters.
5 If the roadway sections include pads or grade limits, and a site model exists, select the site model and click Update from the Object Info palette.
~~~~~~~~~~~~~~~~~~~~~~~~~
 Creating
NURBS Roadways
Creating
NURBS RoadwaysMode |
Tool |
Tool set |
|---|---|---|
Modes for Creating NURBS Curves |
Roadway (NURBS)
|
Site Planning |
The Roadway (NURBS) tool uses NURBS curves to define the road shape. However, the Roadway (NURBS) object does not represent accurate alignments of low-speed roadways, which are typically constructed with arcs (constant radius) and tangents (straight lines); use the Roadway (Poly) tool for this.
NURBS roadways can also be created by drawing a polyline or polygon and then selecting the Create Objects from Shapes command (see Creating Objects from Shapes).
Here is a suggested process for creating a NURBS roadway:
• Create the roadway.
• Select the Send to Surface command to set the road to the existing terrain.
• Select Redistribute and Smooth Curve from the Object Info palette of the selected roadway once or twice to smooth out the road slightly, so it does not follow every hill and valley in the existing terrain.
• Manually reshape the road in 3D as required (to match other road elevations, garage elevations, and so on).
• Only select Redistribute Stations for more or fewer station annotations. Fewer stations are easier to work with when sketching and reshaping, but a road construction company might require more stations to be specified. Redistribute Stations is also useful to ensure that the station spacing is equal after reshaping the road.
To create a road with the Roadway (NURBS) object:
1 Click the tool and mode.
Multiple roadway tools share the same position on the tool set. Click and hold the mouse on the visible tool to open the Ferramentas Pop-out list and select the desired tool.
The following modes are available.

See Creating NURBS Curves for information on which mode to select.
2 Click in the drawing file to set the start point of the road, and then click to set the position of each additional NURBS vertex. Double-click the last point to complete creation of the roadway (NURBS) object.
The first time you use the tool in a file, a properties dialog box opens. Set the default properties. The properties can be edited from the Object Info palette.
► Click to show/hide the parameters.
3 If necessary, use the Reshape tool to modify the locations of the vertices after object creation, or use the vertex editing controls from the Object Info palette to move the vertices or change the degree of vertices.
4 Update the site model. Select the site model and click Update from the Object Info palette.
~~~~~~~~~~~~~~~~~~~~~~~~~
 Creating
a Roadway with the Vectorworks Landmark Commands
Creating
a Roadway with the Vectorworks Landmark CommandsThe Vectorworks Landmark road commands create a roadway with a multi-step procedure. The centerline of the road is defined with a polyline, and then stakes are added. The elevation of the stakes, which are initially set to the surface of the site model, can be modified before the road is created. Finally, the site model is updated and modified by the road object.
The Roadway (Poly) tool is the most straightforward, yet flexible way of creating a roadway in the Vectorworks Architect and Landmark products.
~~~~~~~~~~~~~~~~~~~~~~~~~
 Creating the Road Centerline
Mode |
Tool |
Tool set |
|---|---|---|
Modes for the Polyline Tool |
Polyline
|
Basic |
The road design elements can be created on a separate layer to facilitate modifications later.
To create the road centerline:
1 If desired, create a new layer for the road by selecting Tools > Organization. The layer scale should be the same as the site model layer scale. Set the site model layer to visible, and select View > Layer Options > Show/Snap Others.
2 Click the tool and create a polyline that represents the road shape.
For more information on polylines, see Creating Polylines.
Interior vertices of the polyline must be arc-smoothed (no Bézier or cubic vertices).
Smooth vertices with the Modify > Poly Smoothing > Arc Smoothing command.
The road must be contained within the site model grade limits.
~~~~~~~~~~~~~~~~~~~~~~~~~
 Placing
Station Points Along the Road Polyline
Placing
Station Points Along the Road PolylineCommand |
Workspace: Path |
|---|---|
Station on Polyline |
• Designer: AEC > Roads • Landmark: Landmark > Roads |
The Vectorworks Landmark product places station points (stake objects) along the selected polyline at a specified interval.
To place station points:
1 Select the polyline, and then select the command.
2 The Place Station Points Along Polyline dialog box opens. This command places stations at 100’ (or 30.48 m) intervals. In addition, partial station points can be placed at smaller intervals. Enter the interval between partial stations and select a labeling option for the curve information.
► Click to show/hide the parameters.
The first time you use the command in a file, a properties dialog box opens. Set the default properties. The properties can be edited from the Object Info palette. Stake properties are described in Inserting Stake Objects.
Each station point is labeled. If curve data tables were created, they can be selected and moved if necessary.

3 The stakes have all been set to the elevation of the site model; the next step is to automatically set the road stake elevations as described in Setting Stake Elevations.
~~~~~~~~~~~~~~~~~~~~~~~~~
 Setting
Stake Elevations
Setting
Stake Elevations Command |
Workspace: Path |
|---|---|
Align Stakes Vertically |
• Designer: AEC > Roads • Landmark: Landmark > Roads |
In Placing Station Points Along the Road Polyline, the stake elevations were set according to the site model; in real situations, a road is often set to a grade other than natural grade. The Align Stakes Vertically command sets the elevation of the stakes to a specific plane.
To set the stake elevations with a linear alignment:
1 Set the elevation of only one of the terminal stakes (one of the stakes at the ends of the segment to align) by selecting the stake and entering its elevation in the Object Info palette. If a site model was present when the Station on Polyline command was executed, the elevation of the stake is set to the proposed site model elevation for reference.
2 In the segment to align, press the Shift key to select both the first and last stake (the stakes at either end of the desired elevation alignment), and then select the command.
The Align Stakes Vertically dialog box opens.
3 Enter either a slope value as a rise over run ratio for the road (using a forward slash (/) as a delimiter), or the elevation of the last stake.
The elevations of the stakes located between the selected stakes are set to the specified plane.
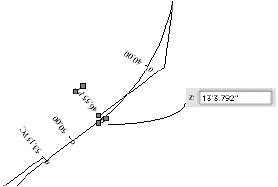
~~~~~~~~~~~~~~~~~~~~~~~~~
 Creating
the Road
Creating
the RoadCommand |
Workspace: Path |
|---|---|
Create Road from Stakes |
• Designer: AEC > Roads • Landmark: Landmark > Roads |
This procedure creates the road by automatically making a single polyline roadway, or by creating curved or straight road objects between each stake. The road follows the centerline polyline, and is set to the elevations specified by the stakes.
To create the road:
1 Select the center polyline or any of the station points, and select the command.
The Create Road from Stakes dialog box opens. Enter the road parameters.
► Click to show/hide the parameters.
2 The polyline and stakes are used to create a Roadway (Poly) object, or a series of road sections between adjacent stakes.
The first time a road is created in a file, a properties dialog box opens. Set the default properties. The properties can be edited from the Object Info palette.
3 If a single roadway was created, create a pad and grade limits for the roadway to modify the site model by selecting the options from the Object Info palette. See Creating Polyline Roadways.
If a set of straight and curved roads was created, the straight and curved sections of the road need to become site modifiers by selecting the road sections and then selecting Use Site Modifiers from the Object Info palette. Use the Custom Selection command to select the straight and curved road sections; see Creating Custom Selection Scripts. The grade limits offset can be set manually, or the grade limits can be turned off and created separately using the Create Grade Limits from Pad command (see Creating Grade Limits Automatically). When site modifiers are used, each road section contains a pad (see Creating a Pad or Pad with Retaining Edge and Creating Grade Limits).
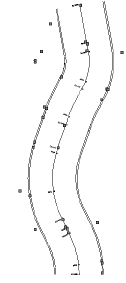
Stakes should not be moved (except in elevation) when using the Create Road from Stakes command. If an additional stake is required, add a vertex point to the polyline, provide an elevation value, and run the Create Road from Stakes command again.
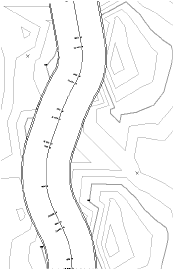
4 The proposed site model requires updating. Select the site model and click Update from the Object Info palette.
If the road was created on a different layer from the site model, click Site Model Settings from the Object Info palette and ensure that Use Site Modifiers on includes the layer with the road.
The proposed site model is updated. If Use Site Modifiers is selected for the road sections, the contour lines are adjusted to rise or fall to meet the level of the road.

~~~~~~~~~~~~~~~~~~~~~~~~~
 Creating
and Joining Straight and
Curved Roadways
Creating
and Joining Straight and
Curved RoadwaysTool |
Tool set |
|---|---|
• Roadway (Straight)
• Roadway (Curved)
• Roadway (Tee)
|
Site Planning |
Simple roadway tools allow you to assemble and join straight and curved roadway sections. The roadway tools can modify the site model.
To create a straight or curved roadway section, or a roadway intersection:
1 Click the desired tool.
2 Create the roadway section in the drawing.
• To place a straight roadway section, click once to define the starting point of the road, and then click again to set the ending point.
• To place a curved or tee roadway section, click to place the object in the drawing, and click again to set the rotation.
The first time you use each tool in a file, a properties dialog box opens. Set the default properties. The properties can be edited from the Object Info palette.
3 Continue to assemble the roadway by placing curved and straight sections, as well as tee intersections.

► Click to show/hide the parameters.
4 If the roadway sections include pads or grade limits, and a site model exists, select the site model and click Update from the Object Info palette.
~~~~~~~~~~~~~~~~~~~~~~~~~


