The Vectorworks Architect product provides several tools for creating and managing space programming study information in both tabular and graphical formats, including an adjacency matrix, bubble diagram, and stacking diagram.
In an adjacency matrix worksheet, information is used to automatically create the following items in the drawing:
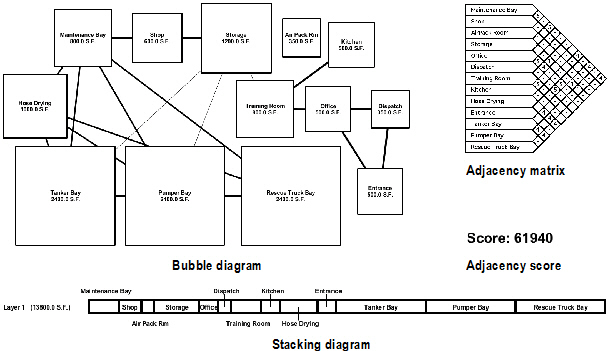
• a bubble diagram, containing space objects for each space in the matrix, with the appropriate area and department information, and space links connecting the spaces, with line weights indicating the strength of the relationship between the spaces
• an adjacency matrix diagram
• an adjacency score object, showing the total lengths of all the space links
• a stacking diagram
The space objects are square when they are first created, but they can be reshaped with the Reshape tool. The spaces can be repositioned to create clusters of related spaces.
~~~~~~~~~~~~~~~~~~~~~~~~~
 Creating
an Adjacency Matrix
Creating
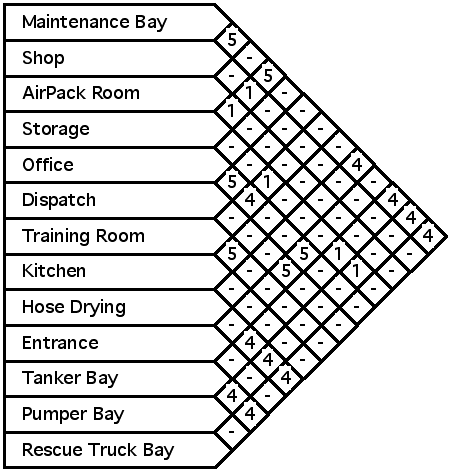
an Adjacency MatrixAdjacency matrices specify, in tabular format, the spaces and area requirements that must be incorporated into a design. In addition, the relationships among the various spaces are identified. Spaces which should be located next to each other are strongly related, while spaces which can or should be separated have a weak relationship.
An adjacency matrix is typically developed in a spreadsheet program and imported into a Vectorworks file. An adjacency matrix can also be created in a worksheet in a Vectorworks file, exported as a tab-delimited file, and then imported back into a Vectorworks file to create an adjacency matrix.
~~~~~~~~~~~~~~~~~~~~~~~~~
 Creating
an Adjacency Matrix Worksheet
Creating
an Adjacency Matrix WorksheetTo create an adjacency matrix worksheet:
1. From the Resource Browser, select Resources > New Resource > Worksheet.
2. Create the adjacency matrix, using every other row for space names and areas, and alternate rows for specifying the relationships among the spaces.
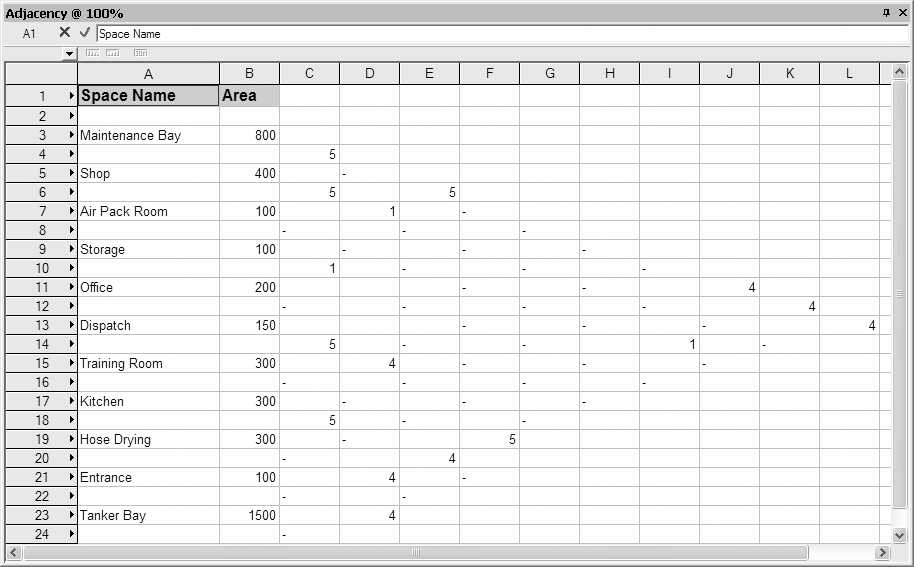
Any third-party spreadsheet program that can save a tab- or comma-delimited text file can be used to create the adjacency matrix. Ensure that there is at least one cell containing data on each spreadsheet row. Certain spreadsheet programs do not export rows without data, which could disrupt the expected sequence of data in the file as it is imported into the Vectorworks file.
3. Click File > Export > E xport Worksheet to export the worksheet as a tab- or comma-delimited file.
4. Click OK and specify the name and location of the file.
~~~~~~~~~~~~~~~~~~~~~~~~~
 Importing
an Adjacency Matrix Spreadsheet
Importing
an Adjacency Matrix SpreadsheetTo import an adjacency matrix:
1. Ensure that the file to be imported is a tab- or comma-delimited file.
2. Select AEC > Space Planning > Import Adjacency Matrix. The Import Adjacency Matrix dialog box opens. Specify the adjacency matrix file import options.
Click to show/hide the parameters.
3. Click OK to import the adjacency matrix. If this is the first time an adjacency matrix, stacking diagram, spaces, or space links are placed in the file, the object properties dialog box opens for each type of object. Accept the default values and click OK.
~~~~~~~~~~~~~~~~~~~~~~~~~
 Inserting
an Adjacency Matrix
Inserting
an Adjacency MatrixAn adjacency matrix diagram can also be created manually with the Adjacency Matrix tool, based on spaces and space relationships currently in the file.

To insert an adjacency matrix diagram:
1. Click the Adjacency Matrix tool from the Space Planning tool set.
2. Click at the desired location for the adjacency matrix.
3. Click again to set the matrix rotation. If this is the first time an adjacency matrix diagram is placed on the drawing, the object properties dialog box opens. Specify the default preferences, which apply to all adjacency matrix diagrams placed subsequently in this drawing. Properties can be edited later in the Object Info palette. Click OK.
The adjacency matrix is created. If no space objects currently exist in the drawing, an adjacency matrix place holder is created.
The adjacency matrix is more than just a presentation graphic, because it dynamically shows what is in the drawing. The adjacency matrix updates automatically when spaces or space links change.
The Rotation, Height Scale and Width Scale parameters of an adjacency matrix can be edited in the Object Info palette.
To adjust the order of adjacency matrix spaces, change the Matrix Order number in the Object Info palette for the relevant space object.
~~~~~~~~~~~~~~~~~~~~~~~~~
 Creating
a Bubble Diagram
Creating
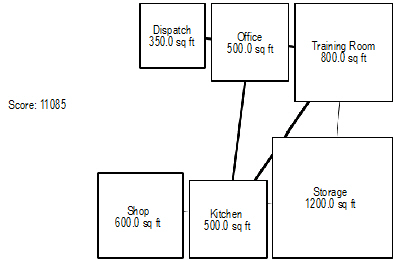
a Bubble DiagramA bubble diagram is a graphical view of the data from a space planning spreadsheet. Spaces are connected by space links that represent the relationships among the spaces. Thick links indicate a strong relationship between the spaces, while weak relationships are drawn with thin lines. The efficiency of the bubble diagram layout can be determined by calculating its adjacency score.
A bubble diagram is inserted into a drawing automatically when an adjacency matrix is imported (see “Importing an Adjacency Matrix Spreadsheet” on page 434). A bubble diagram can also be created manually by linking spaces with the Space Link tool.
~~~~~~~~~~~~~~~~~~~~~~~~~
 Linking
Spaces
Linking
Spaces
To link spaces:
1. Create spaces as described in “Creating Spaces with the Space Tool” on page 399.
2. Click the Space Link tool from the Space Planning tool set.
3. Click on the first space to link, and then on the second space. The space link is automatically created.
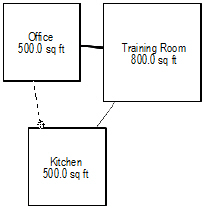
The space links update dynamically as the spaces are moved around in the drawing.
To change the strength of a link, select it and change the Strength value (from 1 to 18) in the Object Info palette.
~~~~~~~~~~~~~~~~~~~~~~~~~
 Calculating
the Adjacency Score
Calculating
the Adjacency ScoreThe adjacency score object displays a numerical value that represents the efficiency of the space layout. The score value is determined by first multiplying the link length times strength for each space link, and then calculating the sum of these values for all the space links in the file. The lower the score, the more efficient the layout.

To insert an adjacency score object:
1. Click the Adjacency Score tool from the Space Planning tool set.
2. Click in the document to set the object location.
3. Click a second time to set the object rotation.
If spaces or space link objects are deleted, the adjacency score object value is not automatically updated. Slightly move any space or adjacency score object in the document to reset the adjacency score object value.
~~~~~~~~~~~~~~~~~~~~~~~~~
 Creating
a Stacking Diagram
Creating
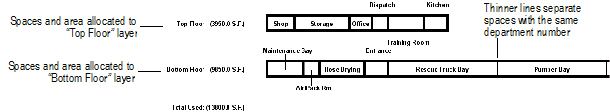
a Stacking DiagramA stacking diagram provides a floor-by-floor representation of the total amount of area taken up by all the spaces on the floors. It is useful for balancing the allocation of spaces among several floors.
A stacking diagram is inserted into a drawing automatically when an adjacency matrix is imported (see “Importing an Adjacency Matrix Spreadsheet” on page 434). A stacking diagram can also be inserted manually with the Stacking Diagram tool. The stacking diagram is based on spaces and space relationships currently in the file.

To insert a stacking diagram:
1. Click the Stacking Diagram tool from the Space Planning tool set.
2. Click at the desired location for the stacking diagram. Click again to set the diagram rotation. If this is the first time a stacking diagram is placed on the drawing, the object properties dialog box opens. Specify the default preferences, which apply to all stacking diagrams placed subsequently in this drawing. Properties can be edited later in the Object Info palette. Click OK.
3. The stacking diagram is created.
The layers are “stacked” on the basis of their layer elevation values, which can be changed in the Organization dialog box (Tools > Organization).
If no space objects currently exist in the drawing, a stacking diagram place holder is created.
Like the adjacency matrix, the stacking diagram dynamically shows what is in the drawing. The stacking diagram updates automatically when spaces or space links are changed. In addition, fill attributes assigned to spaces are reflected in the stacking diagram automatically.
The Rotation, Height Scale and Width Scale parameters of an adjacency matrix can be edited in the Object Info palette. In addition, the Gap Scale parameter controls the distance between the stacking diagram rows. Show Totals toggles the display of the total amount of space used.
The stacking diagram is arranged in rows that correspond to the layers of the drawing. The spaces present in each layer are shown in separate rows; the layer name and total area used are displayed to the left of each row.
Spaces in the stacking diagram are grouped by Department name (set for each space in the Object Info palette). Adjacent spaces with the same Department name are separated by thin lines.